Texas’ economic output per worker in the subsector rose from about $70,900 in 1997 to $91,900 in 2015.
Medical Equipment and Supplies and Miscellaneous Manufacturing
This subsector includes industries that manufacture surgical, dental and optical instruments and supplies; recreational goods such as sporting equipment, toys, office supplies and musical instruments; and other items intended for daily use. Many of its industries rely heavily on export activity and research and development investments to develop innovative products.
59,000
Direct & Indirect Employment
$3 Billion
State Subsector GDP
$52,953
Average Annual Wage
$4.9 Billion
Exports
Sources: U.S. Bureau of Economic Analysis, Regional Economic Models, Inc., Emsi, U.S. Department of Commerce International Trade Administration
INDUSTRIES WITHIN THE MISCELLANEOUS MANUFACTURING SUBSECTOR
The Medical Equipment and Supplies industry is considered an “advanced industry,” as defined by the Brookings Institution. Such industries are distinguished by R&D spending per worker ranking in the top 20 percent of industries, and a share of workers with levels of scientific and technical knowledge exceeding the national average. Their emphasis on innovation and highly skilled workers makes advanced industries essential to growing prosperity and rising standards of living.
Sources: U.S. Bureau of Economic Analysis, Texas Comptroller of Public Accounts
| Description | Direct Jobs 2016 | Job Change 2010-2016 | Average Texas Salaries 2016 | Location Quotient 2016 |
|---|---|---|---|---|
| Subsector Totals | 30,493 | 11.9% | $52,953 | 0.62 |
| Medical Equipment and Supplies | 11,929 | 2.0% | $56,821 | 0.47 |
| Jewelry and Silverware | 2,435 | 6.2% | $53,971 | 1.10 |
| Sporting and Athletic Goods | 2,235 | 22.7% | $53,170 | 0.62 |
| Doll, Toy, and Game Manufacturing | 304 | 41.3% | $46,913 | 0.33 |
| Office Supplies (except Paper) Manufacturing | 931 | -5.3% | $34,514 | 0.97 |
| Sign Manufacturing | 6,098 | 39.4% | $44,948 | 0.97 |
| All Other Miscellaneous Manufacturing | 6,560 | 11.7% | $55,805 | 0.69 |
Source: Emsi
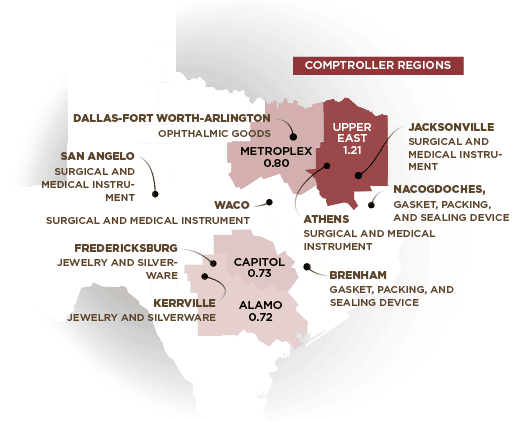
REGIONAL SUBSECTOR LQs AND AREAS OF INDUSTRY SPECIALIZATION BY METRO AREA
Location quotient (LQ) compares an industry’s share of jobs in a specific region with its share of nationwide employment.
This subsector’s share of employment in the Upper East region is 21 percent higher than in the U.S., led by medical equipment manufacturing in areas such as Athens and Jacksonville.
Sources: Emsi, Texas Comptroller of Public Accounts
- Upper East Region LQ < 1.21
- Jacksonville: Surgical and Medical Instruments
- Athens: Surgical and Medical Instruments
- Metroplex LQ 0.80
- Dallas, Fort Worth, Arlington: Ophthalmic Goods
- Capital Region LQ 0.73
- Alamo Region LQ 0.72
- Fredericksburg: Jewely and Silverware
- Kerrville: Jewely and Silverware
- Other Regions LQ < 0.72
- San Angelo: Surgical and Medical Instruments
- Waco: Surgical and Medical Instruments
- Nacogdoches: Gasket, Packing and Sealing Devices
- Brenham: Gasket, Packing and Sealing Devices
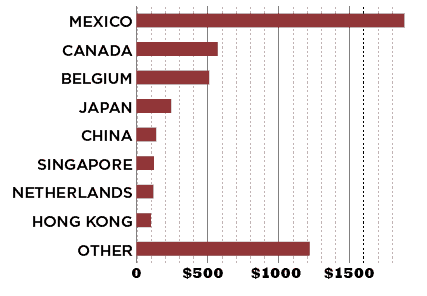
SUBSECTOR EXPORTS FROM TEXASIN MILLIONS OF DOLLARS

| Trade Partner | 2016 Exports | 2016 Share |
|---|---|---|
| Mexico | $1,887.68 | 38.5% |
| Canada | $571.36 | 11.6% |
| Belgium | $510.60 | 10.4% |
| Japan | $243.31 | 5.0% |
| China | $137.10 | 2.8% |
| Singapore | $121.86 | 2.5% |
| Netherlands | $117.20 | 2.4% |
| Hong Kong | $100.15 | 2.0% |
| Other | $1,219.92 | 24.8% |
Sources: Source: U.S. Department of Commerce International Trade Administration
This subsector’s exports from Texas rose from $2.27 billion in 2006 to $4.9 billion in 2016, a 116 percent increase. Half of these exports ended up in Mexico or Canada.
Conclusion
Manufacturing continues to drive output and productivity in the Texas economy, creating jobs paying well above the statewide average. It also contributes significantly to job creation in other industries, particularly in design operations and services.
The miscellaneous manufacturing subsector, including medical equipment and supplies and a variety of recreational goods, consists of innovative, advanced industries and is export-intensive. The subsector is not highly concentrated in Texas as a whole; there is a high regional employment concentration, however, in the state’s Upper East region.


