Textile Mills, Textile Product Mills, Apparel, and Leather and Allied Products ManufacturingNAICS 313-316 Overview
Textiles Subsector Snapshot | Printable (PDF) Textiles Snapshot
Introduction
U.S. and Texas manufacturers of textiles, apparel and leather have incurred significant job losses as production has steadily moved overseas to cheaper labor markets. Some areas of Texas – like El Paso – still maintain a large presence of textile and apparel jobs, but these areas, too, have experienced heavy job losses within these subsectors.
There is evidence of startup activity in American factories, as businesses focus on innovation and quality. Some advanced products and materials can only be produced in the U.S., and there is increased demand from consumers for environmentally sustainable and ethically produced products. Firms also recognize that having production nearby improves quality control and the ability to meet demand faster.
Fast Facts
- These four manufacturing subsectors provided about 17,120 direct jobs in 2016, as well as another 5,100 indirect jobs.
- The four subsectors contributed $1.1 billion to the Texas GDP in 2015.
- Average annual wages were nearly $36,200 in 2016.
- Texas exports for the four subsectors totaled $2.8 billion in 2016.
Subsector Descriptions
- Textile mills:
- This subsector transforms a basic fiber into a product such as yarn, thread or fabric. These products are further used to manufacture consumer items like clothing, carpets, sheets, towels, upholstery, textile bags and other similar items.
- Textile product mills:
- This subsector manufactures textile products (except apparel) from purchased fabrics, generally using cut and sew processes.
- Apparel manufacturing:
- This subsector produces clothing for men, women and children, including fabric accessories, such as hats, gloves and neckties. Establishments in this subsector may manufacture products through cut and sew processes of purchased fabrics, or establishments may first knit fabrics to further cut and sew into finished garments.
- Leather and allied products
- This subsector transforms hides into leather for final consumption. Common products include luggage and handbags, as well shoes and boots.
- The subsector also includes products made from “leather substitutes,” such as rubber, plastics and textiles. Examples include plastic purses and wallets, textile luggage and rubber footwear. These products are made using similar processes to leather product manufacturing and are often manufactured in the same establishments.
Subsector Presence in Texas
There were just over 17,100 textile, apparel and leather manufacturing jobs in Texas in 2016. The average annual wage for these jobs was about $36,200. The top occupations within these subsectors include sewing machine operators, knitting and weaving machine setters, and shoe and leather workers and repairers.
The presence and share of these subsector jobs in Texas is small compared with the U.S. average – with the exception of leather and allied products manufacturing. Texas has a lower share of employment in these subsectors than nationally, as gauged by location quotient (LQ), a measure of employment concentration in a given area compared to a larger region. An LQ value of 1.00 means employment in the region is equal to its share nationwide; the higher the LQ value, the more “concentrated” the industry is in the region. It can also indicate which jobs are “unique” to a region. Texas’ 0.17 LQ in the textile mills industry means statewide jobs are just 17 percent of the industry’s nationwide share, while leather products manufacturing jobs in Texas are 80 percent higher (Exhibit 1).
| Subsector | 2016 Direct Jobs | 2016 Average Wages | 2016 Location Quotient | Top Occupation |
|---|---|---|---|---|
| Textile mills | 1,590 | $44,168 | 0.17 | Textile Knitting and Weaving Machine Setters, Operators, and Tenders |
| Textile product mills | 5,836 | $33,689 | 0.61 | Sewing Machine Operators |
| Apparel manufacturing | 5,318 | $37,632 | 0.5 | Sewing Machine Operators |
| Leather and allied products | 4,376 | $35,017 | 1.8 | Shoe and Leather Workers and Repairers |
Sources: Emsi and Texas Comptroller of Public Accounts
Subsector Job Changes
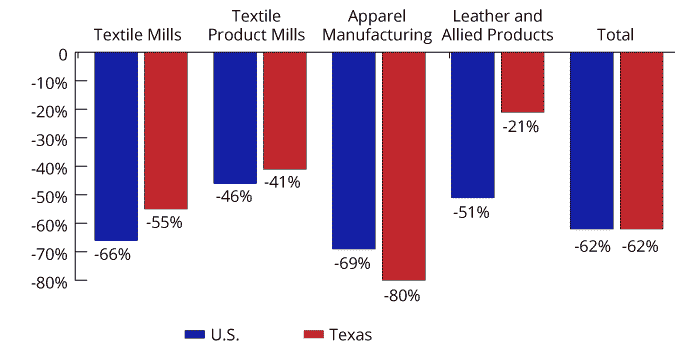
U.S. and Texas employment incurred heavy losses from 2001 through 2016 in the textiles, apparel, leather and allied product subsectors, including an 80 percent drop in apparel manufacturing jobs. Texas manufacturing jobs in leather and allied products did fare better than national trends, only falling 21 percent compared to 51 percent nationwide. In total, the four subsectors declined by 62 percent in the U.S. and Texas from 2001 through 2016 (Exhibit 2).
Exhibit 2: Textiles Products, Apparel, Leather and Allied Products Manufacturing, Percent Change in Employment, 2001 to 2016

| Subsector | Percent Change U.S., 2001 to 2016 | Percent Change Texas, 2001 to 2016 |
|---|---|---|
| Textile Mills | -66% | -55% |
| Textile Product Mills | -46% | -41% |
| Apparel Manufacturing | -69% | -80% |
| Leather & Allied Product Manufacturing | -51% | -21% |
| TOTAL | -62% | -62% |
Sources: Emsi and Texas Comptroller of Public Accounts
Subsector Job Projections
Despite these long-term job losses, the Texas Workforce Commission projects that employment will increase for all four subsectors from 2014 through 2024. Overall, Texas employment in these subsectors is expected to rise by 1,900 jobs, or 11.1 percent, during this period (Exhibit 3).
| Subsector | Number of Jobs, 2014 to 2024 | Percent Growth, 2014 to 2024 |
|---|---|---|
| Textile Mills | 320 | 15.2% |
| Textile Product Mills | 520 | 8.5% |
| Apparel Manufacturing | 520 | 11.1% |
| Leather & Allied Product Manufacturing | 540 | 12.6% |
| TOTAL | 1900 | 11.1% |
Source: Texas Workforce Commission
Economic Output Trends
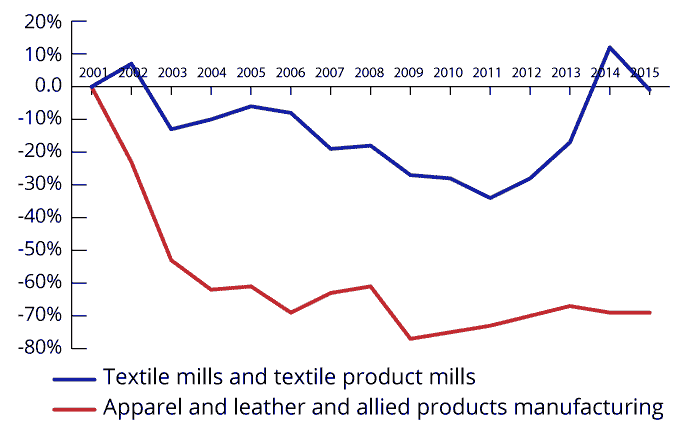
As Texas employment in apparel manufacturing has declined, so too has its contribution to state economic output. From 2001 through 2015, Texas’ inflation-adjusted GDP in apparel, leather and allied products manufacturing fell 69 percent. Texas’ inflation-adjusted values in textile mills and products were about equal to 2001 levels (Exhibit 4).
Exhibit 4: Textiles Products, Apparel and Leather Products Manufacturing, Percent Change in Real GDP in Texas,
2001-2015
(Indexed to 1997)

| Year | Textile Mills and Textile Product Mills | Apparel and leather and allied products manufacturing |
|---|---|---|
| 2001 | 0% | 0% |
| 2002 | 7% | -23% |
| 2003 | -13% | -53% |
| 2004 | -10% | -62% |
| 2005 | -6% | -61% |
| 2006 | -8% | -69% |
| 2007 | -19% | -63% |
| 2008 | -18% | -61% |
| 2009 | -27% | -77% |
| 2010 | -28% | -75% |
| 2011 | -34% | -73% |
| 2012 | -28% | -70% |
| 2013 | -17% | -67% |
| 2014 | 12% | -69% |
| 2015 | -1% | -69% |
Sources: U.S. Bureau of Economic Analysis and Texas Comptroller of Public Accounts
| Description | 2001 | 2015 | Percent Change |
|---|---|---|---|
| Textile mills and textile product mills | $497 Million | $494 Million | -1% |
| Apparel and leather and allied products manufacturing | $1,480 Million | $464 Million | -69% |
Sources: U.S. Bureau of Economic Analysis and Texas Comptroller of Public Accounts
Conclusion
Manufacturing continues to drive output and productivity in the Texas economy, creating jobs paying well above the statewide average. It also contributes significantly to job creation in other industries, particularly in design operations and services.
U.S. and Texas jobs in the textiles, apparel and leather manufacturing subsectors fell by 62 percent from 2001 through 2016. These developments are expected and have occurred in other advanced economies, as production easily moves to cheaper labor markets.

