THE U.S. AEROSPACE INDUSTRY CARRIED AN $86.8 BILLION TRADE SURPLUS IN 2016.
Aerospace and other Transportation Equipment Manufacturing
The aerospace manufacturing industry designs and builds aircraft, missiles, space vehicles and their components, including engines and auxiliary parts. The industry uses innovative production processes such as 3-D modeling to design prototypes for parts and components. It contributes heavily to research and development investment and export activity. Other transportation manufacturing industries include railroad equipment, ship and boat manufacturing facilities, motorcycles and military armored vehicle manufacturing.
176,440
Direct & Indirect Employment
$12.9 Billion
State Subsector GDP
$97,836
Average Annual Wage
$9.8 Billion
Exports
Sources: U.S. Bureau of Economic Analysis, Regional Economic Models, Inc., Emsi, U.S. Department of Commerce International Trade Administration
AEROSPACE WORKFORCE SKILLED AND AGING
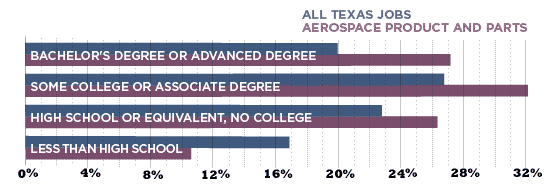
The aerospace industry employs a highly educated and skilled workforce. About 60 percent of its Texas employees have at least some college experience compared to 47 percent of all employed Texans in 2016. But many workers are reaching retirement age. About 32 percent of them were aged 55 and older in 2016 compared to just 20 percent for all Texas jobs. These trends are spurring concerns of a skills shortage in the industry.
Source: U.S. Department of Commerce International Trade Administration
Texas Workforce Age Distribution in Aerospace Product and Parts, 2016
| Age | Under 45 | 45-54 | 55-64 | 65+ |
|---|---|---|---|---|
| All Texas Jobs | 58.6% | 21.1% | 15.0% | 5.3% |
| Aerospace Products and Parts | 39.1% | 29.3% | 26.9% | 4.7% |
Sources: Emsi, Texas Comptroller of Public Accounts
EDUCATIONAL LEVELS OF EMPLOYED TEXANS†
2016 - 3RD QUARTER
| Education | All Texas Jobs | Aerospace Products and Parts |
|---|---|---|
| Bachelor's/Advanced Degree | 20.0% | 27.2% |
| Some College/Associate Degree | 26.8% | 32.2% |
| High School or Equivalent (No College) | 22.8% | 26.4% |
| Less Than High School | 16.9% | 10.6% |
†Does not include workers aged 24 or younger, for which educational attainment data is not available. Sources: U.S. Census Bureau, Quarterly Workforce Indicators
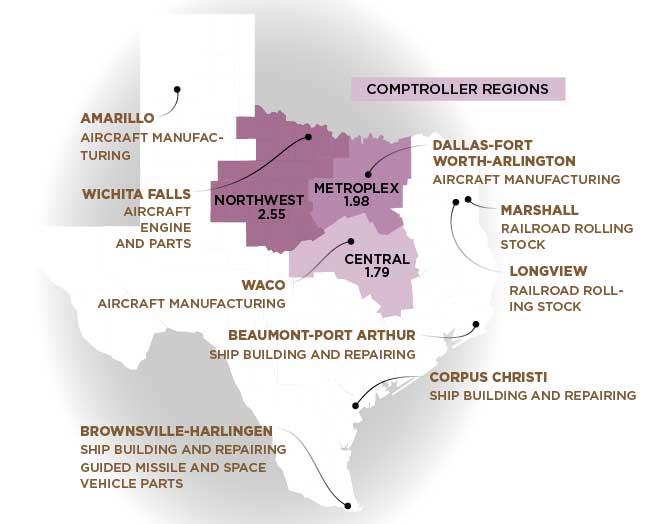
REGIONAL SUBSECTOR LQs AND AREAS OF INDUSTRY SPECIALIZATION BY METRO AREA
Location quotient (LQ) compares an industry’s share of jobs in a specific region with its share of nationwide employment.
Aerospace and other transportation employment is 2.55 times more concentrated in the Northwest region than in the U.S. overall. The Metroplex and Central Texas regions also have high industry employment concentrations.
- High Plains Region LQ < 1
- Amarillo: Aircraft Manufacturing
- Northwest Region LQ 3.92
- Wichita Falls: Aircraft Engines and Parts
- Metroplex Region LQ 1.43
- Dallas-Fort Worth-Arlington: Aircraft Manufacturing
- Upper East Region LQ < 1
- Marshall: Railroad Rolling Stock
- Longview: Railroad Rolling Stock
- Central Region LQ 1.79
- Waco: Aircraft Engines and Parts
- Gulf Coast Region LQ < 1
- Beaumont-Port Arthur: Ship Building and Repairing
- South LQ < 1
- Corpus Christi: Ship Building and Repairing
- Brownsville-Harlingen: Ship Building and Repairing, Guided Missile and Space Vehicle Parts
Sources: Emsi, Texas Comptroller of Public Accounts
| Description | Direct Jobs 2016 | Average Texas Salaries 2016 | Location Quotient 2016 |
|---|---|---|---|
| Subsector Totals | 51,829 | $97,836 | 0.92 |
| Aerospace Product and Parts Manufacturing | 44,639 | $103,498 | 1.10 |
| Railroad Rolling Stock Manufactuirng | 3,060 | $65,754 | 1.42 |
| Ship and Boat Building | 3,713 | $62,575 | 0.33 |
| Other Transportation Equipment | 417 | $41,180 | 0.15 |
*Source: Emsi
Conclusion
Manufacturing continues to drive output and productivity in the Texas economy, creating jobs paying well above the statewide average. It also contributes significantly to job creation in other industries, particularly in design operations and services.
Unlike many manufacturing industries, the aerospace industry generates a trade surplus, as the U.S. leads in innovative production processes. Recent U.S. aerospace business earnings have been strong, benefiting from global economic growth, rising incomes and greater demand for leisure travel in emerging economies. Texas added 1,500 aerospace jobs from January to July 2017, a 3.5 percent increase, compared to 0.6 percent nationally.
Manufacturing
Subsectors
- Aerospace and other transportation equipment
Snapshot - Automobile-Related Manufacturing
Snapshot - Chemical Product
Snapshot - Chemical Product and Pharmaceutical
Snapshot - Computer and electronic products
Snapshot - Electrical equipment, appliances and components
Snapshot - Fabricated metal products
Snapshot - Food, Beverage and Tobacco Products
Snapshot - Furniture and Related Product
Snapshot - Machinery manufacturing
Snapshot - Miscellaneous manufacturing
Snapshot - Nonmetallic mineral product
Snapshot - Paper Manufacturing
Snapshot - Plastics and rubber products
Snapshot - Primary Metals
Snapshot - Textile Mills, Textile Product Mills, Apparel, and Leather and Allied Products
Snapshot - Wood Products
Snapshot
More Economic Data
- Community Colleges
- Cybersecurity
- Energy
- Manufacturing
- Military Bases
- NASA
- Ports of Entry
- Presidential Libraries
- Regional Data
- Rural Law Enforcement
- Supply Chains
- Water
- Women in the Workforce
Economic Data Links skipped


