Glenn Hegar
Texas Comptroller of Public Accounts
Glenn Hegar
Texas Comptroller of Public Accounts
Skip navigation
Glenn Hegar
Texas Comptroller of Public Accounts
Skip navigation
Top navigation skipped.

industry: Special Edition on Energy

September 2024 | By Trinity Elkins, Nathan Gonzales and Bianca Schutz

LNG Liquefied Natural Gas

The liquefied natural gas (LNG) industry in Texas is a crucial component of the state’s energy sector, driven by abundant natural gas reserves and extensive infrastructure. Texas’ location and robust export capabilities make it a key player in the global LNG market, contributing significantly to the state’s economy and energy independence.
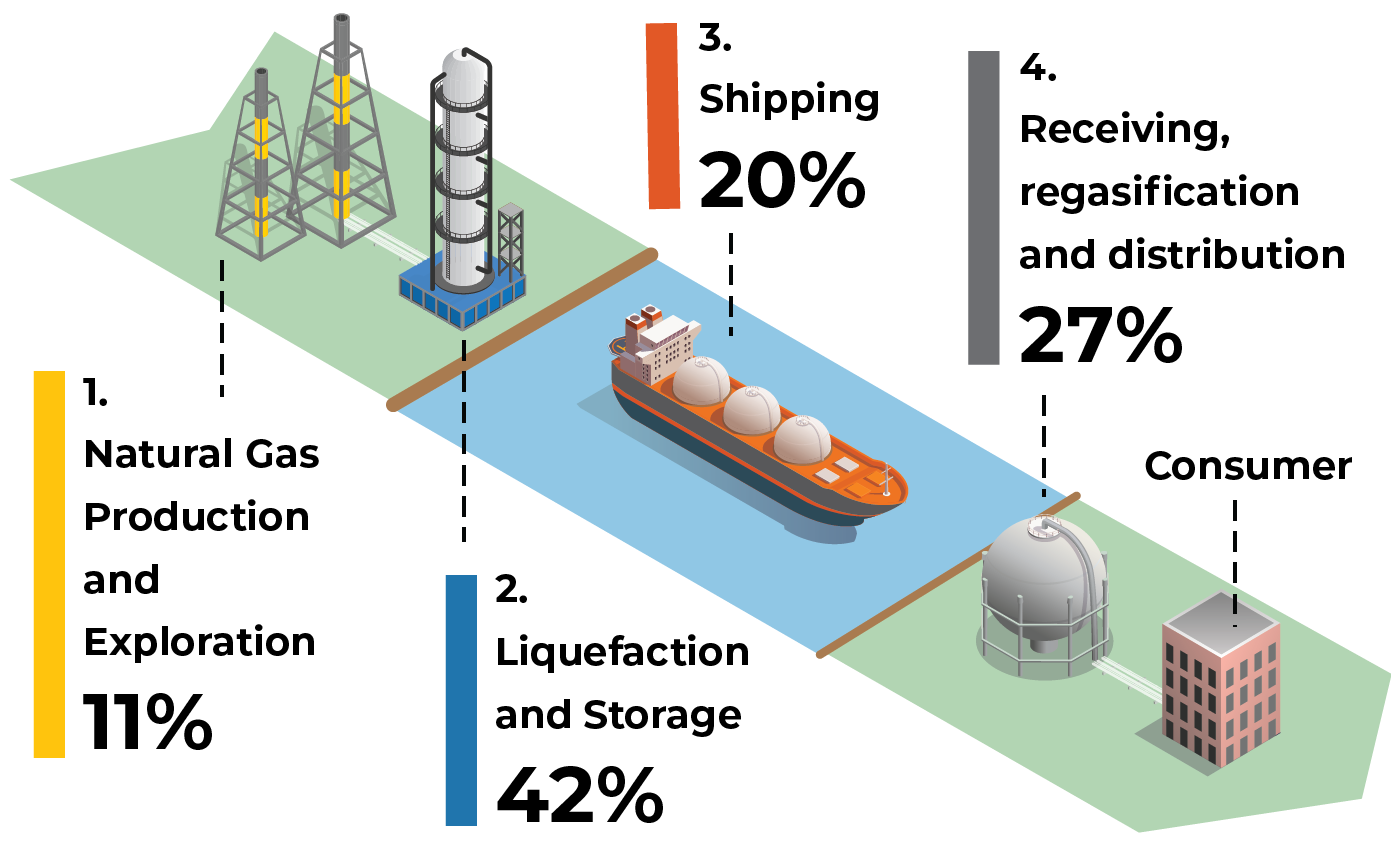


Cost Distribution of LNG Value Chain Percentages represent the share of total cost of the LNG process.


LNG Value Chain

1. Natural Gas Production and Exploration 11%

  • The top 10 counties in Texas for natural gas production are Webb, Reeves, Midland, Martin, Loving, Culberson, Reagan, Upton, Panola and La Salle.
  • Major shale formations in Texas are Barnett-Woodford Shale, Eagle Ford Shale, Haynesville-Bossier Shale and Barnett Shale.

2. Liquefaction and Storage 42%

  • Two operational LNG liquefaction export terminals are in Texas:
    1. Corpus Christi LNG, owned by Cheniere, has three trains operating and works in conjunction with Corpus Christi Pipeline L.P. to deliver natural gas across the country.
    2. Freeport LNG Development currently has three trains in operation and uses the Stratton Ridge meter station, also owned by Freeport LNG, to deliver natural gas across the state and country.

3. Shipping (usually transported by LNG carriers) 20%

  • LNG loading takes place at the exporting site and is shipped to an onshore receiving terminal or offshore unit with receiving capabilities.

4. Receiving, Regasification and Distribution 27%

  • Regasification usually occurs as the LNG is being discharged from the transportation vessel. LNG is reheated with at least one heat exchanger and converted to gas, then it’s sent through pipelines to end consumers, which include power plants, factories and homes.

Economic Impact

  • Four LNG terminals actively under construction have a combined investment of at least $49 billion.
  • Exports of Texas LNG were valued at $9.1 billion in 2023, accounting for 27.3 percent of LNG exports nationwide.

Texas LNG Export Values and Texas Share of Total U.S. LNG Exports, 2018-2023

View export data.
Year Texas Value Texas Exports as Share of U.S. Total
2018 $0.73 12.5%
2019 $1.74 18.3%
2020 $4.27 32.4%
2021 $10.97 40.7%
2022 $12.23 25.9%
2023 $9.13 27.3%

Coastal Map of LNG Producers and Proposed Sites (Import and Export)

Map of LNG facilities on the Texas coast

Active sites:

  • Freeport LNG, owned by Freeport LNG Development, opened in 2008 (Chapter 313 #244-246, 1559). This was the first import facility in Texas. Located in Quintana.
  • Corpus Christi Liquefaction Site, owned by Cheniere (Chapter 313 #1916-1918). Located in Corpus Christi Bay.
  • Golden Pass LNG, owned by Golden Pass Products LLC and ExxonMobil (Chapter 313 #376-378, 1856, 1962). Located in Sabine Pass.

Under construction:

  • Corpus Christi Liquefaction Stage III, owned by Cheniere (Chapter 313 #362, 1916-1918). Located in Corpus Christi Bay. Approximately $8 billion in investment.
  • Golden Pass LNG Trains 1-3 in Sabine Pass (1-2 in 2025 and 3 in 2026). Approximately $10 billion in investment.
  • Port Arthur LNG Trains 1-2 in Port Arthur (2027 and 2028), owned by Sempra. Total capital expenditures are $13 billion.
  • Rio Grande LNG Trains 1-3 in Brownsville, owned by NextDecade (1 in 2027 and 2-3 in 2028 or 2029). Approximately $18.4 billion in project financing.

Approved, not yet under construction:

  • Rio Grande LNG, owned by NextDecade, located in Brownsville (Phase 2).
  • Freeport LNG Development Train 4, owned by Freeport LNG, located in Quintana.

Growth of the Industry

273%
Increase

The increase in export facilities in Texas has resulted in a 273 percent increase in LNG exports since 2019, when only four trains were operational. In 2023, the state exported more than 1.3 billion cubic feet (Bcf), accounting for 31 percent of U.S. LNG exports. According to the Federal Energy Regulatory Commission, there are currently 22 trains under construction that are projected to be operational by 2028.


Top LNG Export Destinations from Texas, 2023

All Geographic Regions (World Total)
$9.13 Billion


View export destination data.
Region 2023 Value (In Billions) Percent
Netherlands $1.20 13.1%
France $1.17 12.8%
United Kingdom $0.88 9.7%
Spain $0.73 8.0%
South Korea $0.66 7.2%
China $0.61 6.6%
Japan $0.54 5.9%
Italy $0.45 4.9%
Portugal $0.28 3.0%
Turkey $0.28 3.0%
Other Countries $2.35 25.7%
Worldwide Total 9.13

Note: Totals may not sum due to rounding.

Sources: U.S. Census Bureau, USA Trade Online; American Chemical Society.