Texas’ International Trade
With the nation’s longest stretch of international border and some of its busiest ports, Texas benefits enormously from global trade.

Our state has led the nation in exports for 17 consecutive years. In 2019, Texas exported products worth $328.9 billion, according to the International Trade Administration (ITA). Exports represent about 17.4 percent of Texas’ gross state product (GSP) — the second-highest share of any state and more than double the U.S. average.
Texas also is a major importing state, relying on foreign makers for products, parts and commodities to feed its manufacturing and trade sectors. In calendar 2019, Texas was the nation’s second-largest importing state behind California, bringing in nearly $294.9 billion in goods.
All this trade is facilitated by a complex web of supply chains. According to the Peterson Institute for International Economics, the economic contribution of the world’s trade in intermediate parts — the components needed to produce finished goods — is nearly twice that of trade in finished products. It’s particularly important to the auto industry. Trade in intermediate parts is a key feature of Texas’ relationship with Mexico, its largest trading partner.
International trade expands markets for businesses and promotes competition, higher productivity and innovation while reducing consumer costs. But it’s often blamed for stagnant wages, rising inequality and job losses, particularly in manufacturing.
To protect domestic industries, the federal government can impose trade tariffs — essentially taxes on imports. The current administration has used tariffs and renegotiated long-term trade deals in its effort to protect domestic industries, but protectionist moves often invite retaliatory responses that ultimately can increase costs for consumers. Today, U.S. tariff rates are at their highest levels since 1993.
These rising trade tensions already presented Texas with potential economic challenges, but their effects on global commerce will pale in comparison to those caused by COVID-19. Lockdowns across the globe significantly disrupted supply chains and exposed their vulnerability. Multinational companies and governments are reassessing their supply chains to mitigate risks. And global trade — often viewed as a pillar of global cooperation and economic growth — is increasingly a source of mistrust and hostility.
Texas Trends: The Role of Energy
Texas exports tend to rise and fall in response to general economic conditions and volatility in energy prices. As Exhibit 1 illustrates, recent dips in the value of Texas exports coincided with the Great Recession of 2007-09 and the 2015-16 downturn in energy prices.

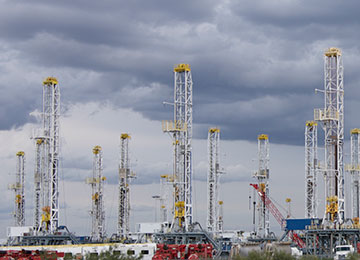
Stacked drilling rigs in Midland
A recovery in oil prices helped boost the value of Texas exports by 42 percent between 2016 and 2019; in this period, Texas’ share of total U.S. exports rose from 16 percent to 20 percent.
Another factor, spurred by greatly increased production from shale formations, was the federal government’s December 2015 removal of a 1975 ban on most oil and gas exports. In 2016, oil and gas represented just 6 percent of Texas’ total exports; by 2019 its share had risen to nearly 23 percent (Exhibit 2), displacing computers and electronic products as the state’s top export product.
Exhibit 1: Texas Export Values and Exports as a Share of Texas Gross State Product, 1999-2019
Note: Export values in nominal dollars (not adjusted for inflation).
Source: U.S. International Trade Administration
| Year | Texas GSP (in Thousands) | Texas Exports (In Thousands) | Exports as a Share of GSP |
|---|---|---|---|
| 1999 | $681,335.4 | $83,177.5/td> | 12.2% |
| 2000 | $738,871.0/td> | 103,865.7/td> | 14.1 |
| 2001 | $773,006.7/td> | 94,995.3/td> | 12.3 |
| 2002 | $787,257.8/td> | 95,427.2/td> | 12.1 |
| 2003 | $829,764.4/td> | 98,920.3/td> | 11.9 |
| 2004 | $906,321.0/td> | 117,403.6 | 13.0 |
| 2005 | $986,401.3/td> | 129,346.2 | 13.1 |
| 2006 | $1,085,294.9/td> | 150,890.1/td> | 13.9 |
| 2007 | $1,178,583.1/td> | 168,228.6/td> | 14.3 |
| 2008 | $1,237,394.9/td> | 192,221.8 | 15.5 |
| 2009 | $1,163,401.3 | 162,994.7 | 14.0 |
| 2010 | $1,237,196.8 | 206,992.4 | 16.7 |
| 2011 | $1,331,220.6 | 251,104.3 | 18.9 |
| 2012 | $1,411,378.7 | 264,664.9 | 18.8 |
| 2013 | $1,502,249.9 | 277,715.5 | 18.5 |
| 2014 | $1,572,818.4 | 285,559.3 | 18.2 |
| 2015 | $1,568,457.0 | 248,780.4 | 15.9 |
| 2016 | $1,565,632.2 | 231,527.5 | 14.8 |
| 2017 | $1,665,631.8 | 265,067.8 | 15.9 |
| 2018 | $1,802,511.2 | 315,834.7 | 17.5 |
| 2019 | $1,886,956.2 | 328,863.8 | 17.4 |
Exhibit 2: Texas Exports by Industry and Share of Total State Exports, 2019
Figures reflect rounding.
Source: U.S. International Trade Administration
| Industry | Share of Total Exports, 2016 | Share of Total Exports, 2019 |
|---|---|---|
| Oil & Gas | 6.0% | 22.9% |
| Petroleum & Coal Products | 15.5% | 15.2% |
| Computer and Electronic Products | 20.4% | 14.9% |
| Chemicals | 15.8% | 13.6% |
| Transportation Equipment | 10.1% | 8.5% |
| Machinery | 8.7% | 7.1% |
| Electrical Equipment | 5.0% | 3.6% |
| Fabricated Metal Products | 3.3% | 2.5% |
| Miscellaneous Manufactured Commodities | 2.1% | 1.7% |
| Agricultural Products | 2.0% | 1.6% |
| Other | 11.1% | 8.3% |
Exhibit 3 further demonstrates the recent importance of Texas oil and gas exports. The state’s exports of oil and gas rose by 439 percent between 2016 and 2019, from $13.9 billion to $74.9 billion.
Exhibit 3: Value of Texas Exports by Industry Sector, 2016 vs. 2019
Source: U.S. International Trade Administration
| Industry | Value 2016 (in Billions) | Value 2019 (in Billions) | Percent Change in Value, 2016-2019 |
|---|---|---|---|
| Oil & Gas | $13.9 | $74.9 | 439.4% |
| Petroleum & Coal Products | $35.8 | $49.6 | 38.5% |
| Computer and Electronic Products | $47.1 | $49.4 | 4.7% |
| Chemicals | $36.6 | $44.6 | 22.0% |
| Transportation Equipment | $23.5 | $28.4 | 20.8% |
| Machinery | $20.0 | $23.4 | 16.7% |
| Electrical Equipment | $11.7 | $11.9 | 2.0% |
| Fabricated Metal Products | $7.7 | $8.3 | 8.1% |
| Miscellaneous Manufactured Commodities | $4.9 | $5.7 | 15.6% |
| Agricultural Products | $4.6 | $5.4 | 18.4% |
| Other | $25.7 | $27.3 | 7.8% |
Top Trade Partners
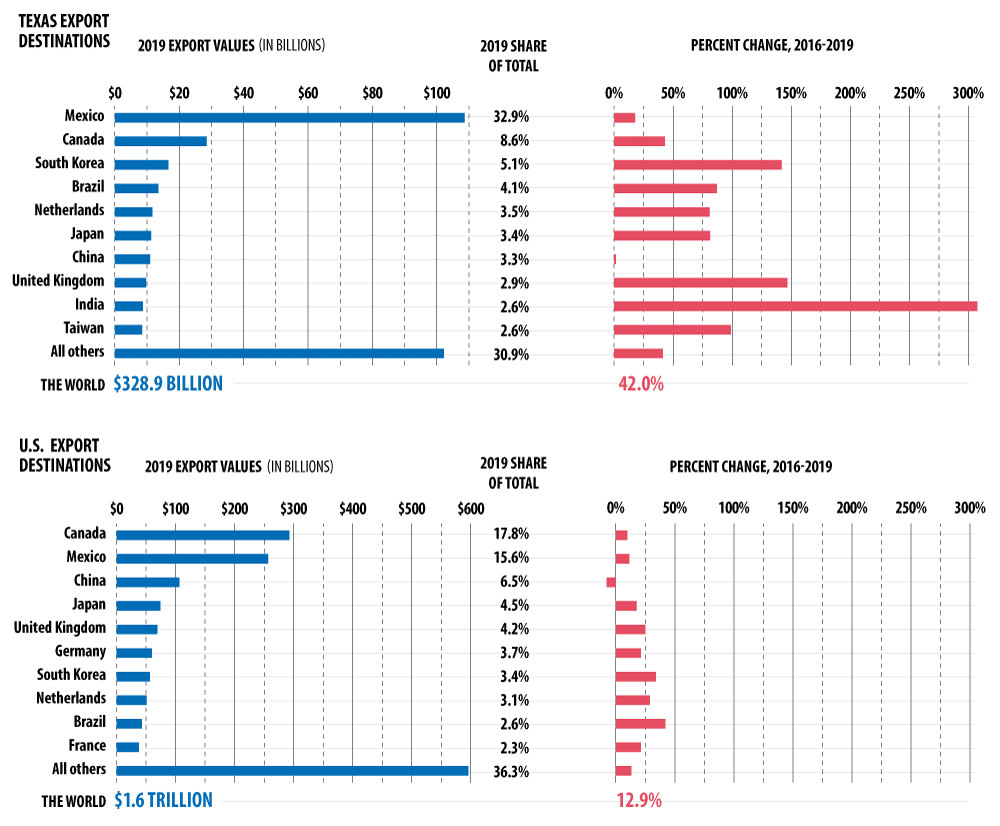
Mexico is Texas’ largest export destination by far, followed by Canada; together, these nations accounted for nearly 42 percent of Texas exports in 2019 (Exhibit 4). Destinations outside North America have led Texas export growth in recent years, however — most notably South Korea, the United Kingdom and India.
Exhibit 4: Top Exporting Destinations, Texas and U.S., 2019; Percent Change, 2016-2019

Figures reflect rounding.
Source: U.S. International Trade Administration
| Texas Export Destinations | 2019 Export Values (Billions) | 2019 Share of Total | Percent Change, 2016-2019 |
|---|---|---|---|
| Mexico | $108.6 | 32.9% | 17.8% |
| Canada | $28.5 | 8.6% | 42.9% |
| South Korea | $16.6 | 5.1% | 141.8% |
| Brazil | $13.5 | 4.1% | 87.1% |
| Netherlands | $11.7 | 3.5% | 80.9% |
| Japan | $11.3 | 3.4% | 81.2% |
| China | $11.0 | 3.3% | 1.5% |
| United Kingdom | $9.7 | 2.9% | 146.7% |
| India | $8.7 | 2.6% | 307.7% |
| Taiwan | $8.5 | 2.6% | 98.8% |
| All others | $102.2 | 30.9% | 41.3% |
| World | $328.9% | 42.0% |
| U.S. Export Destinations | 2019 Export Values (Billions) | 2019 Share of Total | Percent Change in Value, 2016-2019 |
|---|---|---|---|
| Canada | $292.6 | 17.8% | 9.7% |
| Mexico | $256.6 | 15.6% | 11.4% |
| China | $106.4 | 6.5% | -7.9% |
| Japan | $74.4 | 4.5% | 17.6% |
| United Kingdom | $69.1 | 4.2% | 25.1% |
| Germany | $60.1 | 3.7% | 21.3% |
| South Korea | $56.5 | 3.4% | 33.8% |
| Netherlands | $51.1 | 3.1% | 28.9% |
| Brazil | $42.9 | 2.6% | 41.9% |
| France | $37.7 | 2.3% | 21.1% |
| All others | $595.7 | 36.3% | 13.1% |
| World | $1,643.2 | 12.9% |
Tariffs and Trade Deals
According to the ITA, Texas’ exports to China fell by 34 percent between 2018 and 2019, while total U.S. exports to China fell by nearly 12 percent, reflecting an ongoing trade war. At the trade war’s peak in mid-2019, the federal government was enforcing 25 percent tariffs on about $200 billion worth of Chinese products. China responded with tariffs on about $75 billion worth of American goods. The average U.S. tariff on Chinese goods rose from 3 percent in January 2018 to more than 20 percent by April 2020.
The current administration also has been critical of the North American Free Trade Agreement (NAFTA). Reforms to the agreement came in the form of the United States-Mexico-Canada Agreement (USMCA), signed into law on Jan. 29, 2020, and effective on July 1, 2020.
“The USMCA is not fundamentally different from NAFTA,” says Karl Kuykendall, an associate director with information services company IHS Markit. “It does more to solidify the North American trading relationship than to change existing trade flows.”
The USMCA incentivizes more automotive production in North America, requiring that at least 75 percent of the components of any vehicle assembled in the partner nations must be sourced from them — up from NAFTA’s 62.5 percent requirement. It also adds a new requirement that 30 percent of auto content produced in the partner nations must be made by workers earning at least $16 per hour, increasing to 40 percent of content in three years. This provision puts pressure on Mexican factories, where average wages are about a third of the $16 per hour requirement.
USMCA also modernizes the trade pact by adding provisions on e-commerce and digital trade, industries that didn’t exist when NAFTA was implemented in 1994. It also expands labor and environmental protections and increases protections for intellectual property rights. Finally, the USMCA increases U.S. access to the Canadian dairy market, a key priority of the federal administration.
Steel and Aluminum
Steel and aluminum are vital inputs for a wide variety of manufactured products, from autos to modern office buildings. In 2019 alone, the U.S. imported about 25.3 million metric tons of steel (PDF), nearly half of it from Canada, Mexico and Brazil, as well as about 3.7 million metric tons of aluminum.
In 2018, the federal government imposed 25 percent tariffs on imported steel and 10 percent on imported aluminum. The goal was to reduce reliance on imported metals while revitalizing activity at shuttered metalworks plants across the U.S. The tariffs, however, increased metal prices for buyer industries.
Texas imports more steel and aluminum than any other state, largely to make pipelines and drilling equipment for the energy industry. A 2017 study commissioned by the American Petroleum Institute (PDF) estimated that about 77 percent of the steel used in new pipelines is imported. The 2018 tariffs took effect at a time when Texas energy producers were dealing with a glut of oil and gas and were desperate to build more pipelines and storage facilities. According to one study, Texas’ imports of steel and aluminum rose by 22 percent from 2017 to 2019.
Some Texas leaders, including Governor Greg Abbott, have suggested that tariffs and protections for metalworks plants could harm important industries, noting that Texas’ oil and gas sector employs more people than the entire nation’s steel and aluminum makers.
To further bolster those industries, the U.S. introduced additional tariffs in January 2020 on imports of steel and aluminum articles such as nails, auto bumpers and wires. Those tariffs are levied at the same rate as the 2018 tariffs on imported metals: 25 percent on steel products and 10 percent on aluminum products. The USMCA, however, exempts imports of these metals and products from Mexico and Canada from all tariffs.
NAFTA and Texas
NAFTA, established in January 1994, was a groundbreaking trade deal between the U.S., Mexico and Canada that largely eliminated tariffs on goods traded among the three nations. It included labor, environmental and intellectual property provisions that would influence successive trade deals across the globe. NAFTA quickly became embedded in the fabric of the Texas economy:
- Mexico and Canada are responsible for 40 percent of Texas’ imports of intermediate goods used in manufacturing.
- Much of the Permian Basin’s oil and gas is exported for use in Mexican oil refineries and gas-fired power plants. Texas natural gas produces about a quarter of Mexico’s electricity.
- U.S. natural gas exports to Mexico have nearly doubled since 2015 and are approaching 2 trillion cubic feet per year.
- NAFTA partners also supply big markets for Texas agriculture; more than 80 percent of Texas’ dairy and poultry exports go to Mexico.
The U.S. Chamber of Commerce estimates (PDF) that NAFTA-related trade supports about 387,000 Texas jobs.
Trade in Uncertain Times
Trade tensions showed signs of cooling in early 2020. The USMCA agreement restored business and investment certainty in North America, and in late 2019 the U.S. and China signed an agreement that would cut tariffs and increase trade between the world’s largest economies, a positive development after years of trade war escalation.
But then came the pandemic. COVID-19 is upending trade flows around the world and causing an abrupt global recession expected to be worse than the Great Recession of 2007-09.
The Census Bureau reports (PDF) that, between March and April 2020, U.S. exports and imports of goods fell by 29 percent and 15 percent, respectively. In Texas, exports fell by 30 percent and imports dropped by 23 percent. Yet while it appears trade will continue to suffer this year, an IHS Markit analysis suggests the long-term outlook for the Texas export industry remains positive.
“COVID-19 will undoubtedly encourage companies to relook at where and how they source their inputs,” says Kuykendall. “There’s a greater incentive now to simplify supply chains and mitigate risk related to future pandemics, trade tensions, natural disasters and other major events.” The pandemic could spur companies to source products closer to home, including in Mexico or low-cost U.S. states. “If reshoring occurred in Mexico, Texas has those business relationships already and the transportation infrastructure to move those goods across the U.S.,” says Kuykendall. “Texas benefits directly or indirectly from reshoring initiatives aimed for North America, especially in the southern U.S. and Mexico. Reshoring initiatives will be more long term. Companies will want to see how this plays out before they make major investment decisions.” FN

