Texas Water: Planning for More

An Ever-Increasing Demand
One challenge springing from Texas’ rapid growth is the increasing pressure it puts on our natural resources — especially water. Texas has a huge number of municipal, agricultural and industrial users all relying on limited sources of surface and groundwater.
As our population and economy continue to grow, the efficient management of this precious resource is becoming increasingly critical.
Supply and Demand
Water planners distinguish between water availability and water supply. Water availability refers to the amount of water in a source that can be withdrawn each year in a serious drought. Supply, on the other hand, represents the amount of that available water currently usable with existing infrastructure and under existing law and water agreements.
The Texas Water Development Board (TWDB) projects that in 2020, our state will have about 24.7 million acre-feet of available water, about half of it groundwater and half surface water. (An acre-foot is the volume of a sheet of water with an area of one acre and a depth of one foot.) Texas’ water supply amounts to about 14.7 million acre-feet, 7.2 million acre-feet in the ground and 7.5 million acre-feet representing surface water.
In 2016, Texas came close to using its entire annual supply, drawing about 14.2 million acre-feet. About 56 percent of that came from groundwater sources, while 42 percent was surface water; 2 percent came from the reuse of treated wastewater. Agricultural users and municipal water systems accounted for nearly 86 percent of the amount used in 2016 (55 percent and 31 percent, respectively). Other significant water users include manufacturers, power stations and oil and gas producers.
Nearly half of all Texas surface water used in 2016 went to municipal water systems (Exhibit 1). Municipal use fluctuates depending on weather conditions; as measured in gallons per capita daily (GPCD), Texas municipal use peaked at 173 GPCD during the 2011 drought, falling to 141 GPCD in 2016. Agriculture was the second-biggest user of surface water, claiming 33 percent of the total (30 percent for irrigation and 3 percent for watering livestock).
The vast majority of groundwater, by contrast, is used for agricultural irrigation (Exhibit 2). Municipal water systems were a distant second, with 18 percent of total use.
EXHIBIT 1: SURFACE WATER USAGE IN TEXAS, 2016, BY ECONOMIC SECTOR
Note: Total may not sum due to rounding.
Source: Texas Water Development Board
EXHIBIT 2: GROUNDWATER USAGE IN TEXAS, 2016, BY ECONOMIC SECTOR
Note: Total may not sum due to rounding.
Source: Texas Water Development Board
Infrastructure
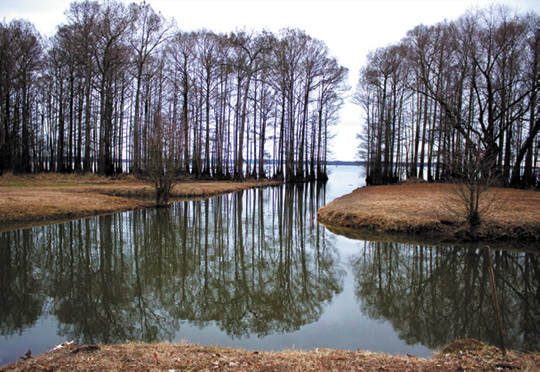
Texas’ groundwater is stored just where the name implies. Its surface water, however, resides in 188 major reservoirs, 15 major river basins and eight coastal basins. Basins are regions drained by a river and its tributaries; reservoirs are large artificial lakes. (Texas has only one natural lake, Caddo Lake on the Texas-Louisiana border.)
There are two types of reservoirs: on-channel, created by damming rivers and restricting the downstream flow of water, as with the Highland Lakes chain in Central Texas; and off-channel, created by piping water from a river to an artificially constructed lake separate from the river itself, such as Wharton County’s new Arbuckle Reservoir.
According to TWDB, more than half of the state’s available surface water, or 8.9 million acre-feet, comes from reservoirs. As of Jan. 31, 2019, the reservoirs collectively were 89.6 percent full; in the past year, their lowest point was 76.1 percent.
Because some parts of Texas typically are much drier than others, a common strategy to meet water needs is to transfer water between different river basins to supplement existing supplies. This practice, called interbasin transfer, involves moving water via canals or pipes. Some areas in Texas receive the majority of their water from interbasin transfers. As of 2014 (most recent available data), the state had more than 150 active interbasin transfer arrangements.
Drying Up?
Texas was once described, in a quote generally attributed to an unnamed meteorologist in the 1920s, as “a land of perennial drought broken by the occasional devastating flood.” Texas is rarely entirely free of drought, particularly in its arid western counties. The “drought of record,” which TWDB uses as a benchmark for future disaster planning, lasted from 1950 to 1957. The years of 2010 through 2014 represented the second-worst Texas drought on record, with 2011 being the single driest year in the state’s recorded history. Dry conditions in that year alone cost the state’s agricultural sector an estimated $7.6 billion, with significant effects in other industries ranging from timber to tourism.

Caddo Lake, on the Texas-Louisiana border
Droughts represent continuing challenges to a rapidly growing state with an economy dependent on reliable fresh water supplies for residential, commercial and agricultural use. But even in the absence of drought, water supply and usage must be planned for and closely monitored.
TWDB expects Texas’ water supply and demand to diverge steadily over the next 50 years, resulting in a supply shortfall of about 8.9 million acre-feet per year by 2070. That’s enough to cover all of Dallas County with 15 feet of water.
In the absence of new sources or additional conservation, the agency expects the state’s water supply to fall by 11 percent from 2020 to 2070, from 15.2 million to 13.6 million acre-feet per year. The projected decline is due largely to an expected reduction in supplies from the Ogallala Aquifer, a huge source of agricultural water, and mandatory pumping restrictions on the Gulf Coast Aquifer, put into place to prevent further subsidence, the gradual sinking of surrounding land.

Toledo Bend Reservoir, Texas’ largest
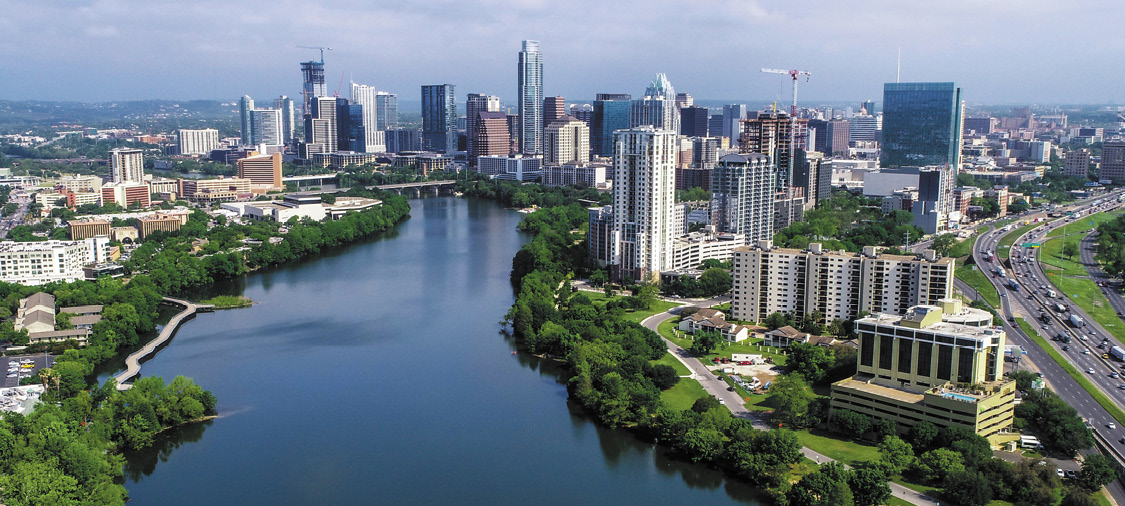
But population growth is likely to put the most urgent pressure on our water supplies. TWDB expects Texas’ population to rise to 51 million by 2070, a 73 percent increase from its projection for 2020. This growth will be heavily concentrated in the state’s urban centers, especially Dallas-Fort Worth and Houston, where municipal water use is expected to soar.
TWDB’s State Water Plan (SWP) anticipates that municipal water need — the amount by which demand exceeds supply — will rise by 568 percent by 2070, leaving the state’s cities in need of 3.4 million additional acre-feet of water in the absence of increased supplies or more restricted use (Exhibit 3). That’s more than three times the entire storage capacity of the Hill Country’s Lake Travis. In all, TWDB predicts the state’s entire water need will rise by 87 percent through 2070.
EXHIBIT 3: PROJECTED STATE WATER NEED, 2020-2070 (IN ACRE-FEET)
Source: Texas Water Development Board
Meeting these challenges will require strategies to improve supply and reduce demand: conservation, the creation of new reservoirs, desalination and more.
State-Regional Planning
Texas’ rapid growth is escalating the need for communities and the state as a whole to protect current water supplies and make detailed plans for future usage.
In Texas, water supply planning has been a policy priority since the drought years of the 1950s. In 1957, the Legislature established TWDB as a state agency to provide financial and logistical assistance to local and regional water entities for long-term projects.
TWDB’s top priority, the State Water Plan, is Texas’ most comprehensive water supply planning tool. The agency’s first formal SWP of 1961 focused on quantifying the state’s surface and groundwater supplies and projecting future water needs through 1980. In 1997 — after another severe drought — the state water planning process was changed in several important ways. In that year, the Legislature required TWDB to establish regional water planning groups and to develop a comprehensive SWP every five years, based on the regional plans.
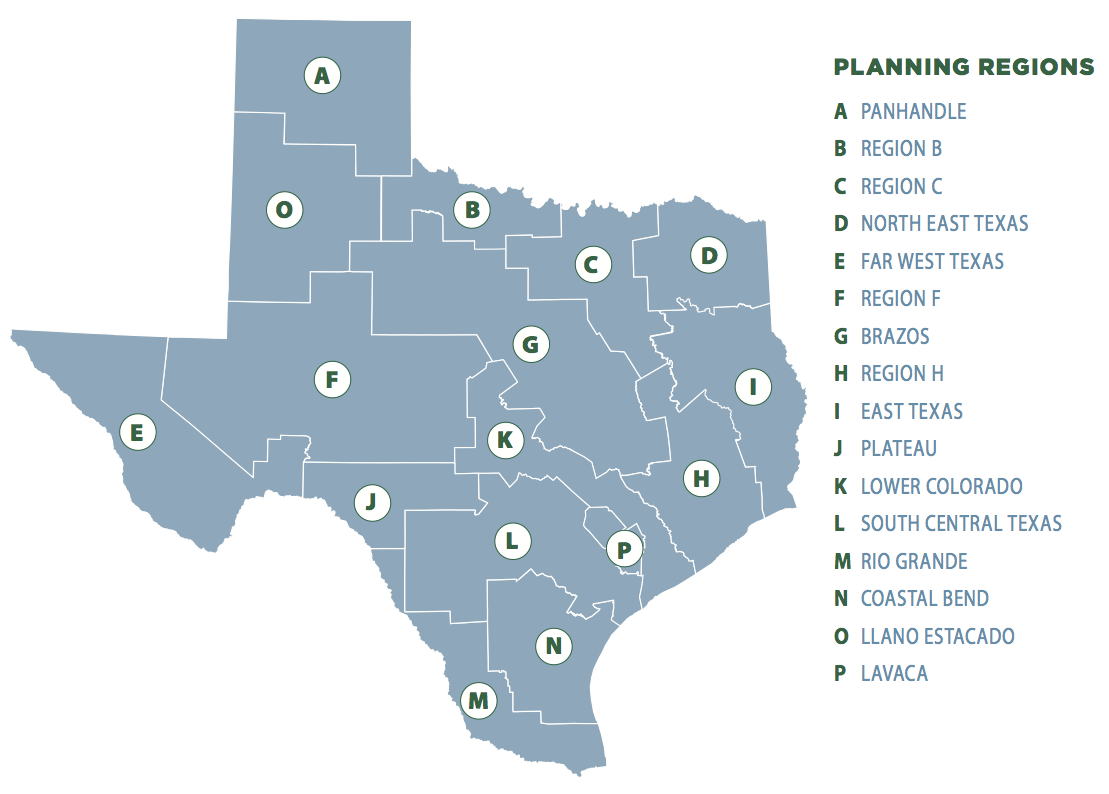
TWDB established 16 regional water planning groups (Exhibit 4), each charged with planning for drought conditions, evaluating future water demands and developing water management plans for its area. In 2002, TWDB developed the first SWP based on this “bottom-up” regional planning process.
EXHIBIT 4: TEXAS WATER PLANNING REGIONS

Source: Texas Water Development Board
The 2017 SWP was the 10th and most recent plan, and the fourth based on the regional planning process. It lists about 5,500 recommended water management strategies to meet the needs of particular user groups (such as agriculture, cities and manufacturers) in each planning area during the next 50 years. The strategies fall into two broad categories: demand management — strategies reducing the requirement for additional water — and water supply — strategies to increase water supplies.
In the 2017 SWP, nearly 70 percent of the water management strategies fall under water supply, with the remainder representing demand management (Exhibit 5).
EXHIBIT 5: SHARE OF RECOMMENDED WATER MANAGEMENT STRATEGIES BY WATER RESOURCE IN 2070
Source: Texas Water Development Board
Water supply strategies generally fall into one of four subcategories in the 2017 SWP: surface water strategies (such as the construction of new reservoirs), reuse strategies (wastewater treatment and reuse), groundwater strategies (the construction of new water wells and the desalination of brackish groundwater) and seawater desalination.
Examples of demand management strategies in the 2017 SWP include irrigation conservation (through technological advances such as low-energy precision application systems that use less water and reduce evaporation) and municipal conservation (including measures such as mandatory low-flow plumbing and landscape watering restrictions).
In addition to water management strategies, the 2017 SWP lists about 2,500 water management strategy projects (WMSPs) involving new infrastructure. These include new major reservoirs and groundwater wells. The cost of all WMSPs across the 16 regional planning groups is estimated at $63 billion over 50 years.
The Cost of Inaction
That’s an enormous amount of money — about two-thirds of the state’s entire net general revenue for fiscal 2018. Yet the cost of doing nothing could be even higher.
An adequate water supply is so essential that the impact of shortages would echo throughout the state economy, affecting everything from power generation to the cattle business. TWDB estimates that a future “drought of record” event could reduce the income of Texas businesses and individuals by $73 billion in 2020 and more than $151 billion in 2070, with accumulating impacts for each year of drought. It also could reduce Texas employment by 424,000 in 2020 and nearly 1.3 million in 2070.
Texas’ water planning process, of course, is intended to ensure that we avoid the harshest consequences of the next — and inevitable — major drought. FN
For more detail on Texas water planning, see the Texas Water Development Board’s most recent State Water Plan.

