Industry Specialization in Texas A Different Way to Examine the State Economy
For decades, researchers have pondered the question of economic diversity.

To most casual observers, a “diverse” economy — one that draws its strengths from a broad variety of industries — is self-evidently a good thing. Texas' continued strength in the face of plunging oil prices is a clear example of how increasing diversification can protect overall economic health when one part of the industrial mix enters rough waters.
On the other hand, there’s no doubt that economic specialization has paid off handsomely for the Silicon Valley area and other research hubs, just as it once did for Detroit — until it didn't.
One way to gauge specialization is to consider what are called “industry clusters” — a cluster being a group of interrelated firms in a single area that provide related products or services and share similar needs for workers and suppliers. A cluster thus may include product manufacturers, their suppliers and subcontractors and those that provide specialized services to them.
Research suggests that industry clusters are associated with increased entrepreneurial activity and employment growth. The “knowledge spillovers” that accompany specialization can spur the development of related or support industries, while concentrations of allied companies often enjoy lower business costs.
Cluster Types
The Harvard Business School’s U.S. Cluster Mapping Project has identified 51 types of “traded” clusters in the U.S. economy, encompassing 778 different industries as defined by the federal government’s North American Industry Classification System. Traded clusters are concentrations of related industries that sell to other regions and nations. Examples include oil and gas production and transportation; aerospace and defense; and financial services.
The project also described 16 local clusters containing 310 industries. Local clusters include groups of related industries that sell primarily to local markets, such as local utilities and health services.
Traded clusters are often unique to one or a few regions, while local clusters typically can be found in every U.S. region. And traded clusters play an outsized role in regional economic competitiveness and vitality; their industries comprise just 36 percent of total U.S. employment yet account for 50 percent of total income and 97 percent of U.S. patents. Thus traded employment is healthy for any region, as its industries are associated with high-paying jobs and innovation.
Traded industry employment accounted for nearly 37 percent of private Texas employment in 2013, slightly down from 2003 levels (Exhibit 1). This share varies widely across the state, though. Traded cluster employment accounted for nearly half of Midland’s total employment in 2013, but just 19 percent in McAllen. According to the U.S. Bureau of Economic Analysis, the Midland metro area had a per capita personal income of $96,463 in 2014, versus just $23,753 in McAllen.
As the exhibit shows, traded employment declined in Texas and most of its metros in this 10-year period, other than in the resource-rich areas of Midland and Odessa.
Exhibit 1: Share of Total Employment in Traded Industries in Texas Metro Areas, 2003 and 2013
| Metro Area | 2003 | 2013 |
|---|---|---|
| Dallas-Fort Worth | 41.40% | 37.70% |
| Houston | 40.70% | 38.50% |
| San Antonio | 34.80% | 32.80% |
| Austin-Round Rock | 39.10% | 34.90% |
| El Paso | 30.90% | 25.70% |
| Beaumont-Port Arthur | 31.70% | 33.10% |
| Corpus Christi | 31.70% | 27.50% |
| Midland | 35.10% | 48.60% |
| McAllen-Edinburg-Mission | 23.50% | 19.00% |
| Odessa | 34.30% | 41.90% |
| Texas | 37.30% | 36.60% |
| United States | 37.30% | 36.00% |
Source: Texas Comptroller of Public Accounts analysis based on U.S. cluster mapping data, Institute for Strategy and Competitiveness, Harvard Business School
Measuring Industry Concentration
We can examine industry clusters in Texas and its metropolitan areas using a simple ratio called a location quotient (LQ), which compares an industry’s share of jobs in a specific geographic area to its share in a larger one.
For our purposes, an LQ equal to 1.00 means the state or metro share is the same as the national share; a value above 1.00 indicates the industry is more concentrated in the state or metro region than it is in the nation as a whole.
In other words, the higher the LQ value, the more concentrated the industry.
Exhibit 2 shows the five most highly concentrated industry clusters in Texas, and their employment performance between 2003 and 2013.
Some of the state’s most specialized clusters are obvious, such as its concentration of oil and gas industries and those involved with transportation and logistics, given the state’s proximity to an international border and its many seaports and airports. But the state also has an above-average presence in smaller industry clusters such as footwear manufacturing.
Unsurprisingly, given that the decade captures a period of rapid population growth in Texas as well as the shale boom, the greatest employment gains were seen in the clusters involving oil and gas production and construction activity. Construction employment rose by 57 percent, more than four times the national pace of growth for this cluster.
Note also that the degree of cluster specialization can change over time. For example, employment in the oil and gas production and transportation cluster nearly doubled in Texas from 2003 to 2013, yet its LQ value declined. Possible explanations are robust job growth in other Texas industries, indicating growing economic diversity, and strong oil and gas growth in other regions of the U.S. For footwear manufacturing, by contrast, LQ values increased despite job losses, indicating that the industry suffered greater relative losses in the nation than in Texas.
Exhibit 2: Five Most Highly Concentrated Traded Clusters in Texas, 2013;
Employment Change, 2003-2013
| Industry Cluster | Location Quotient | Employment | Employment Change | |||
|---|---|---|---|---|---|---|
| 2003 | 2013 | 2003 | 2013 | Total | Percent | |
| Oil and Gas Production and Transportation | 5.59 | 5.38 | 157,560 | 310,019 | 152,459 | 96.8% |
| Construction Products and Services | 1.89 | 2.26 | 93,923 | 147,106 | 53,183 | 56.6% |
| Footwear | 1.54 | 2.23 | 2,910 | 2,824 | -86 | -3.0% |
| Upstream Chemical Products | 2.60 | 2.07 | 33,941 | 29,918 | -4,023 | -11.9% |
| Transportation and Logistics | 1.46 | 1.27 | 170,570 | 167,944 | -2,626 | -1.5% |
Source: Texas Comptroller of Public Accounts analysis based on U.S. cluster mapping data, Institute for Strategy and Competitiveness, Harvard Business School
Exhibit 3 extends this analysis to Texas’ five largest metropolitan areas, showing the most concentrated industry clusters in each.
Exhibit 3: Five Most Highly Concentrated Traded Clusters in Texas’ Major Metro Areas, 2013; Employment Change, 2003-2013
| Metro Area | Industry Cluster | Location Quotient | Employment | Employment Change | |||
|---|---|---|---|---|---|---|---|
| 2003 | 2013 | 2003 | 2013 | Total | Percent | ||
| DFW | Aerospace Vehicles and Defense | 3.52 | 3.60 | 45,097 | 46,983 | 1,886 | 4.2% |
| Financial Services | 1.22 | 1.76 | 68,075 | 81,811 | 13,736 | 20.2% | |
| Transportation and Logistics | 1.62 | 1.52 | 65,266 | 59,325 | -5,941 | -9.1% | |
| Communications Equipment and Services | 2.51 | 1.50 | 30,558 | 17,176 | -13,382 | -43.8% | |
| Oil and Gas Production and Transportation | 1.47 | 1.46 | 14,265 | 24,994 | 10,729 | 75.2% | |
| Houston | Oil and Gas Production and Transportation | 8.29 | 6.72 | 66,931 | 104,851 | 37,920 | 56.7% |
| Upstream Chemical Products | 5.12 | 4.15 | 19,135 | 16,293 | -2,842 | -14.9% | |
| Construction Products and Services | 3.04 | 3.31 | 43,231 | 58,340 | 15,109 | 34.9% | |
| Water Transportation | 2.33 | 2.11 | 13,421 | 14,230 | 809 | 6.0% | |
| Environmental Services | 1.92 | 1.79 | 2,591 | 3,467 | 876 | 33.8% | |
| San Antonio | Footwear | 12.39 | 19.13 | 1,810 | 1,810 | 0 | 0.0% |
| Construction Products and Services | 0.92 | 4.22 | 3,548 | 20,520 | 16,972 | 478.4% | |
| Financial Services | 1.28 | 2.13 | 16,006 | 25,003 | 8,997 | 56.2% | |
| Jewelry and Precious Metals | 1.26 | 1.93 | 325 | 299 | -26 | -8.0% | |
| Insurance Services | 1.92 | 1.88 | 16,611 | 17,508 | 897 | 5.4% | |
| Austin | Jewelry and Precious Metals | 7.29 | 5.03 | 1,770 | 750 | -1,020 | -57.6% |
| Information Technology and Analytical Instruments | 5.47 | 3.22 | 35,574 | 20,265 | -15,309 | -43.0% | |
| Communications Equipment and Services | 1.15 | 1.46 | 2,968 | 4,056 | 1,088 | 36.7% | |
| Biopharmaceuticals | 1.87 | 1.45 | 2,440 | 1,995 | -445 | -18.2% | |
| Business Services | 1.18 | 1.32 | 55,995 | 86,473 | 30,478 | 54.4% | |
| El Paso | Footwear | 20.98 | 35.53 | 820 | 750 | -70 | -8.5% |
| Leather and Related Products | 3.08 | 6.98 | 200 | 295 | 95 | 47.5% | |
| Agricultural Inputs and Services | 1.13 | 3.69 | 157 | 482 | 325 | 207.0% | |
| Transportation and Logistics | 2.18 | 3.26 | 5,265 | 7,175 | 1,910 | 36.3% | |
| Apparel | 7.11 | 3.03 | 3,161 | 561 | -2,600 | -82.3% | |
Source: Texas Comptroller of Public Accounts analysis based on U.S. cluster mapping data, Institute for Strategy and Competitiveness, Harvard Business School
Exhibit 3 illustrates some well-known regional strengths, such as aerospace and financial services in the Metroplex and information technology in Austin. Similarly, El Paso’s increasing concentration in transportation and logistics obviously reflects its strategic location on the border.
And again, LQ values can shift regardless of employment gains and losses. El Paso’s footwear cluster saw job losses yet its LQ increased considerably. Four of the Houston metro area’s five most concentrated industries became less concentrated over the decade, yet all but one saw employment gains.
Specialization declined with heavy job losses in the Austin area’s innovative cluster of information technology and analytical instruments, as did communications equipment and services in DFW. These clusters include highly disruptive and competitive industries, with employment consistently threatened by technological change and international competition.
IT job losses were particularly large in the Austin area, which lost more than 15,000 jobs, mostly in computer and semiconductor manufacturing. As these IT manufacturing jobs disappeared, however, the area’s skilled workers were well positioned to take advantage of emerging technologies in cloud computing, mobile technology and e-commerce, which fall in the business services cluster.
Between 2003 and 2013, this cluster added nearly 30,500 jobs in the Austin metro area. Austin continues to attract high-profile technology companies, including corporate campuses planned by Apple Inc. and Oracle.
A Closer Look: Oil and Gas
Obviously, the oil and gas production and transportation cluster is heavily concentrated in Texas. In 2013, the state had 310,000 jobs in the cluster, about 45 percent of its total U.S. employment. The top three U.S. metros for employment in oil and gas were Houston-The Woodlands-Sugar Land (104,851 jobs), Dallas-Fort Worth-Arlington (24,994) and Midland (23,022). Three Texas metro areas also topped the nation for their percentage of oil and gas cluster employment as a share of total private employment: Midland (28.5 percent), Odessa (14.8 percent) and Victoria (10.9 percent).
Oil and gas cluster employment in Texas rose by 97 percent from 2003 to 2013, versus 75 percent nationwide. Texas accounted for half of the cluster’s U.S. job creation during this decade.
Despite its rapid growth, direct employment in the oil and gas cluster represented only 3.2 percent of Texas’ private, nonfarm jobs in 2013, up from 2.0 percent in 2003. Its concentration, however, varies widely among the state’s metropolitan areas (Exhibit 4).
Exhibit 4: Employment in Oil and Gas Production and Transportation As a Share of Total Private Employment in Selected Texas Metros, 2003 and 2013
| Metro Area | 2003 | 2013 |
|---|---|---|
| Houston-The Woodlands-Sugar Land | 3.2% | 4.3% |
| Dallas-Fort Worth-Arlington | 0.6% | 0.9% |
| Midland | 14.0% | 28.5% |
| Odessa | 5.1% | 14.8% |
| Corpus Christi | 3.9% | 6.3% |
| Victoria | 2.1% | 10.9% |
| Texas | 2.0% | 3.2% |
| United States | 0.4% | 0.6% |
Source: : Texas Comptroller of Public Accounts analysis based on U.S. cluster mapping data, Institute for Strategy and Competitiveness, Harvard Business School
Midland’s share of total private employment in the oil and gas cluster more than doubled between 2003 and 2013. Odessa’s cluster share nearly tripled, while Victoria’s quintupled. In Houston’s more diverse economy, the cluster share edged up only slightly.
Overspecialization?
The oil and gas production and transportation cluster comprises six "sub-clusters" - oil and gas extraction, support activities for oil and gas operations, well drilling, pipeline transportation, oil and gas machinery and petroleum processing.
Consider, for example, the composition of the cluster in two of Texas' major oil and gas hubs, Houston and Midland. Midland’s activity is almost exclusively in drilling and extraction. In Houston, oil and gas activity is much more diverse, with a large share of jobs in related machinery manufacturing, transportation and processing (Exhibit 5).
In short, not only is the Midland area highly concentrated in the oil and gas cluster, it’s highly concentrated in one portion of the cluster - one likely to make the area economy much more sensitive to changing oil prices, since extraction invariably declines when prices make it less profitable.
Exhibit 5: Share of Oil and Gas Sub-Cluster Employment, 2013
| Sub-Cluster | Houston, The Woodlands, Sugar Land |
Midland | Texas |
|---|---|---|---|
| Support Activities for Oil and Gas Operations | 26.7% | 52.1% | 44.0% |
| Oil and Gas Extraction | 17.3% | 23.4% | 16.9% |
| Well Drilling | 14.1% | 19.0% | 14.3% |
| Oil and Gas Machinery Manufacturing | 24.2% | 1.9% | 11.5% |
| Pipeline Transportation | 10.7% | 3.5% | 7.7% |
| Petroleum Processing | 7.0% | 0.0% | 5.6% |
| Total Cluster Employment | 104,851 | 23,022 | 310,019 |
Source: Texas Comptroller of Public Accounts analysis based on U.S. cluster mapping data, Institute for Strategy and Competitiveness, Harvard Business School
Specialization: Too Much Or Too Little?
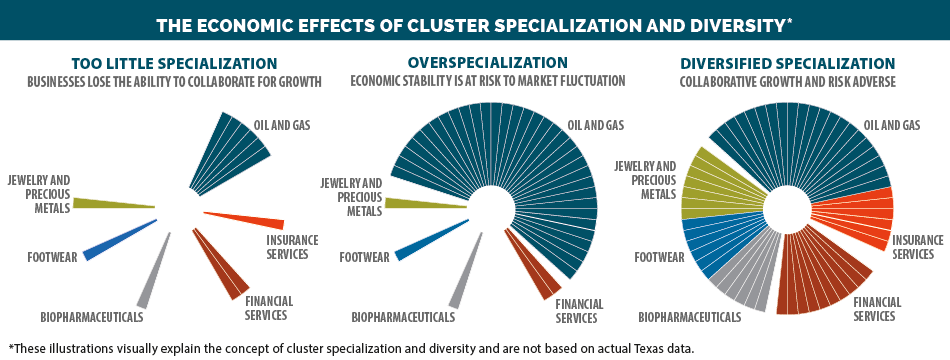
Economic specialization and diversity are both notoriously difficult to measure. Based on most studies in this area, however, one generalization seems largely true: for local and regional economies, specialization can drive economic growth, while diversity promotes economic stability, especially in the face of recession.
The most basic argument for economic diversity resembles the conventional wisdom for personal finances: a diverse portfolio spreads and therefore minimizes risk.
Of course, the concepts aren’t necessarily mutually exclusive. A 2008 study noted that the ideal setting for entrepreneurial activity “is probably a diversified city made up of many specialized clusters.”
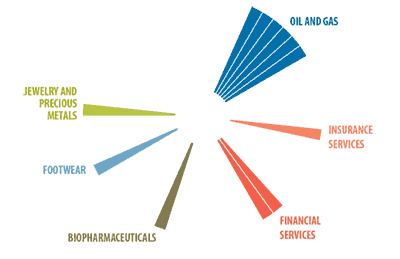
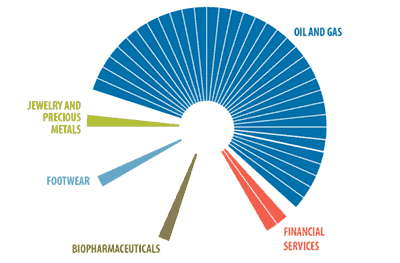
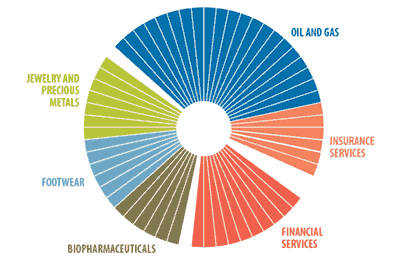
The Economic Effects of Cluster Specialization and Diversity*
Too Little Specialization
Businesses lose the ability to collaberate for growth.

Overspecialization
Economic stability is at risk to market fluctuations.

Diversified Specialization
Collaberative growth and risk avoidance.

* These illustrations visually explain the concept of cluster specialization and diversity and are not based on actual Texas data.
The presence of multiple industry clusters can allow regions to adapt to changing economic realities. While Houston’s oil and gas cluster is reeling from falling oil prices, for instance, the Greater Houston Partnership expects that many of its oil and gas job losses will be cushioned by job gains in petrochemicals and construction, led by the area’s $50 billion investment in its burgeoning petrochemical corridor.
Industry specialization and economic diversity aren’t opposites. While they certainly pull in different directions, together they help strike the kind of economic balance that allows Texas not only to enjoy increasing economic growth but also to better weather economic shocks.
The state, along with many of its metropolitan areas, appears to have learned from the last oil bust, diversifying enough to survive and succeed despite downturns.
While natural resources, population and other critical economic variables differ across Texas’ regions, wherever localities can foster some specialization while maintaining economic diversity, the evidence suggests they should.
For more information on Texas’ regional economies, see the Comptroller’s regional reports. FN


